Report shows education outcomes, costs, enrollment data
The Vermont Agency of Education released the first report from its Listen and Learn Tour, Aug. 30. The State Education Profile Report provides data to guide education leaders, school communities, and the agency as they work together to ensure that every student in Vermont has equitable access to high-quality educational opportunities.
The initial report highlights emerging trends in enrollment, student demographics, student outcomes, staffing, and expenditures. This information is intended to prompt conversations and further exploration.
“The Listen and Learn Tour is an opportunity for us to truly understand the diverse experiences and perspectives within our statewide education system and to ground our conversations in data and evidence,” said Interim Secretary of Education Zoie Saunders. “This report will serve as a shared foundation as we work together towards our shared vision for education in Vermont.”
The agency will continue to collaborate with education leaders and the Commission on the Future of Public Education to prioritize future reporting. Subsequent reports will take a regional approach and compare similar-sized schools and districts to support strategic decision-making.
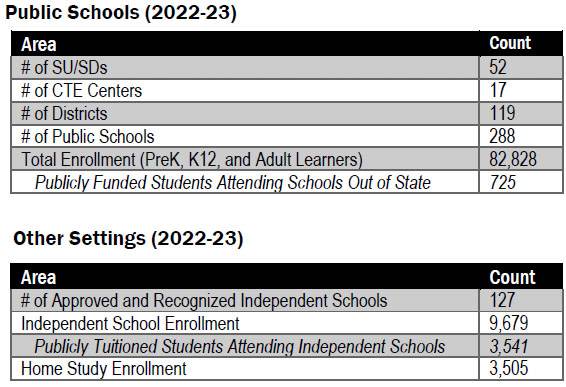
Chart tallies key numbers in state education.
The agency invites all stakeholders to review the report and participate in the ongoing dialogue to shape the future of education in the state. Upcoming stakeholder engagement opportunities will include surveys, regional convenings with education leaders, and listening sessions with educators, families, students, and community members.
Key takeaways
Enrollment trends: Between 2003-04 and 2022-23, overall total enrollment (including prekindergarten, K-12 and adult) in Vermont public schools decreased by 6.2%, while K-12 enrollment decreased by 14.2%. Much of this change occurred pre-pandemic. During this same time period, changes in total enrollment varied between SU/SDs, ranging from a decrease of 3.7% to 16.6%. A small number of SU/SDs did see increases in enrollment.
Student demographic trends: The statewide demographic picture for students is similar between 2019-20 and 2022-23. Student demographics varied widely between SU/SDs, with smaller SU/SDs as a group, on average, having higher percentages of students in special education and who are economically disadvantaged.
Student outcome trends, assessments: Prior to the pandemic (2015-2019), the percentage of students that were proficient and above ranged from 51%-57% in English language arts (ELA), and from 34%-49% in math. There was variance by grade band, especially for math. Post-pandemic (2021-2022), proficiency rates were about 10% lower for all grade bands and subjects, but 2022-23 results on the new Vermont Comprehensive Assessment Program appear higher than 2021-22 results (however, using a new assessment makes comparison difficult). With either assessment program, the state has recorded persistent achievement gaps when comparing subgroups (FRL, ELL and Special Education) on English and math across all grade bands. Vermont student performance on the National Assessment of Educational
Progress, while historically high in reading, has been declining since 2015, trending toward the national average.
Student outcome trends, graduation rates: Looking at both 4-year and 6-year graduation rates in Vermont, rates peaked in 2018-19, at 85% and 92% respectively, and have remained lower post-pandemic.
Staffing, staffing levels: Since 2019-20, the number of teachers, leaders and student services staff per 100 students has increased, meaning SU/SDs are employing a similar or higher number of staff to educate fewer students. On average, staffing levels were related to SU/SD size, with the number of staff per 100 students increasing as SU/SD size decreased. It is important to note that the infusion of federal funding to address the pandemic may have influenced the staffing levels during this time period and raises questions about the sustainability of staff levels in future years.
Staffing, average staff salaries: Since 2019-20, average salaries have increased for all personnel categories by 11.5% to 17.7%. Larger SU/SDs tended to have higher average salaries than smaller SU/SDs in most personnel categories, with differences in salaries being up to $10,000 more, on average, for some positions (like teachers and leaders).
Expenditures, total expenditures per pupil (total enrollment): Since FY20, statewide total expenditures per pupil, using total enrollment, has increased from $22,782 to $27,537; this is in part due to increased federal funding to address the impact of the pandemic. Total expenditures per pupil appears to be largely related to size, with smaller SU/SDs spending more per pupil. In addition, per pupil spending is also linked to student need, with SU/SDs with higher numbers of FRL students spending more per pupil.
Expenditures, total expenditures per equalized pupil: Statewide per pupil expenditures based on equalized pupil counts are slightly lower than those based on total enrollment (for example, $26,579 compared to $27,537 in FY23. Expenditures per equalized pupil shift total enrollment counts by weighting them to reflect the higher costs expected to serve PreK, elementary, middle, secondary, pupils in poverty, and students who are English language learners. Comparing total expenditures per equalized pupil and student performance in 2022-23 found that generally higher performing, lower spending SU/SDs have lower percentages of FRL students, while lower performing, higher spending SU/SDs have higher percentages of FRL students.
Expenditures, special education expenditures: Statewide special education expenditures in SU/SDs increased between FY20 to FY23, from $26,032 to $28,288 per special education student, or $4,796 to $5,284 per pupil (total enrollment). This increase of 10.2% compares to an increase of 20.9% for overall total expenditures and is likely due to the availability of federal pandemic relief funds. As a result, even though special education costs increased, the share of total expenditures for special education also decreased from 21.1% to 19.2%.
The full report is available on the Agency’s website: Education.vermont.gov.
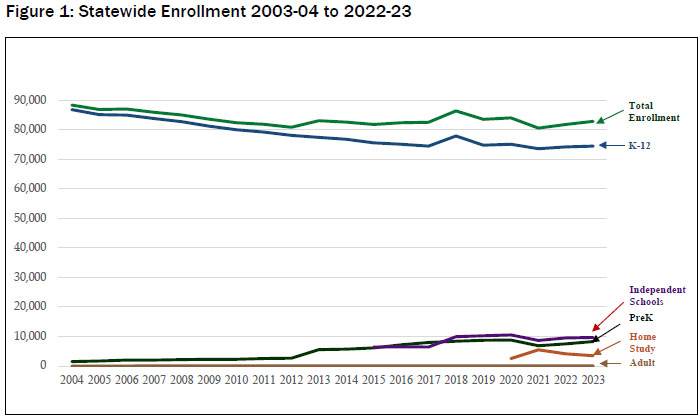
Graph shows statewide enrollment from 2003-04 school year to 2022-23 school year among different types of education as well as total enrollment (top line). Overall there has been a significant decrease in K-12 students, but has leveled off more in recent years.
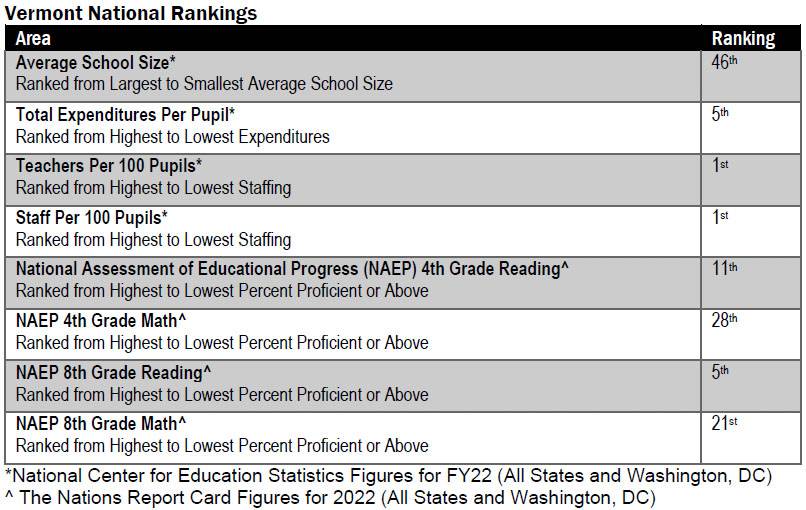
Data from the National Center for Education Statistics shows Vermont’s ranking in 2022.