Vermont nets second most in nation
Staff report
From the beginning of the pandemic in the spring of 2020, to civil unrest and catastrophic wildfires in the summer, to election drama in the fall, 2020 was historically difficult… and yet, statistically fascinating.
Data shows that by several accounts, 2020 has somehow been a year of growth in several markets. S&P 500 hit a historic high in September, eCommerce sales jumped by nearly a third, and home sales are on track to exceed the previous year’s numbers.
All of which is to say, despite all the unpredictability of 2020, Americans kept going, and kept moving — and in record numbers, according to the 2020-2021 HireAHelper American Migration Report.
Where did Americans move in the year of the pandemic? Which states and cities were they most drawn to? Which areas of the country were they most likely to leave? Was anything different about how, when and where Americans moved this past year?
The report helped answered these questions by analyzing over 75,000 moves booked with HireAHelper.com and its partners last year to paint a picture of how Americans moved in 2020.
Seeking safety, saving money, supporting family: How Covid-19 Impacted moving in 2020
To better understand the reasons behind moves Americans made last year, HireAHelper sampled 4,000 customers about what made them move when they did.
In July of 2020, respondents reported an estimated 15% of the moves during this period were forced by the pandemic, but that increased by the end of the year to 25%.
In other words, a quarter of American moves in 2020 were in some part due to the pandemic.

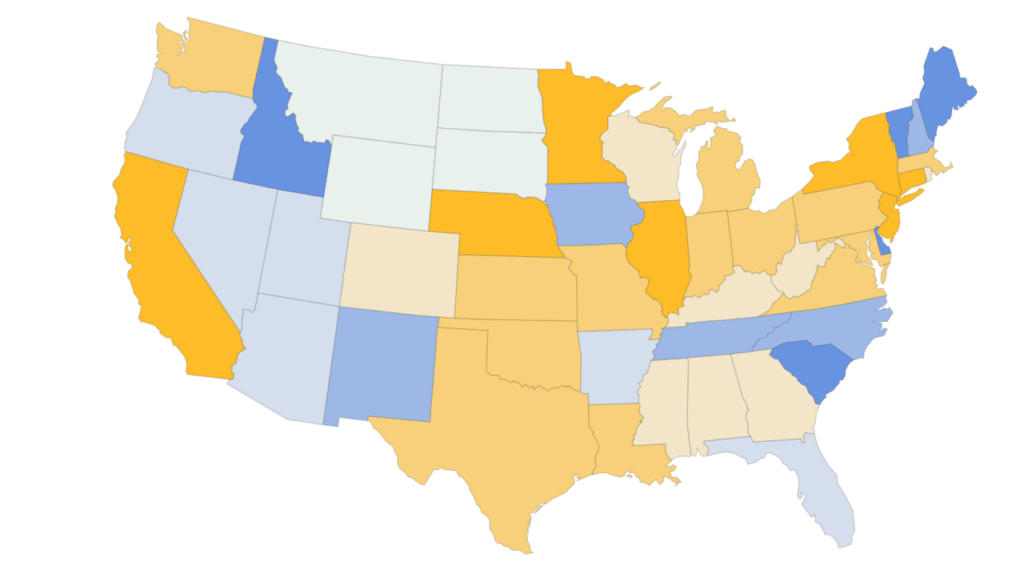
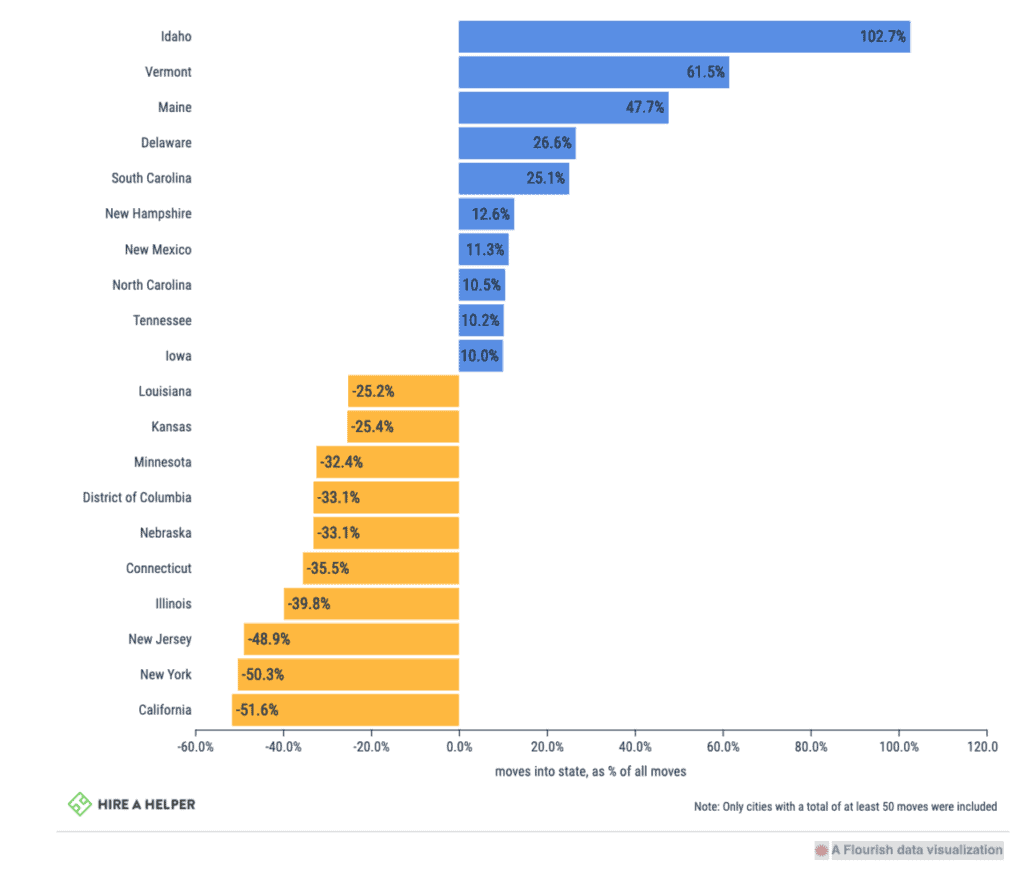
Graph shows moves from or to states as a percentage of all moves. These numbers reflect the population gain rather than straight move-in tallies as in-movers are often more than offset by those moving out. For example, California may still have among the most people moving in, but when offset by those leaving, it actually has the largest ratio lost.
Here are the results of the Covid-19 moving survey:
A total of 36% of respondents moved to somewhere where they felt safer, i.e., somewhere with fewer Covid-19 cases (often with more restrictions). As many as 10% of respondents, however, took the opposite approach and deliberately moved somewhere where lockdowns weren’t as tight and the schools were open.
35% were forced to move due to loss of job or income
31% moved to either shelter-in-place with family or take care of family members
28% moved because they started working from home and no longer had to live close to work
Where Americans moved in 2020
Whether it was business as usual, or because of the pandemic, more Americans moved in 2020 than in 2019, according to our data.
Throughout the year, we’ve seen news of newly-remote workers leaving big cities in droves, reports of students relocating back home as colleges went online, and stories about Americans moving to a different city to wait out the pandemic.
How have all these trends shaped moving ebbs and flows in America in 2020? Where were these moves headed? While no one can claim knowledge of all the moves that took place last year, the data collected puts a finger on the pulse of the latest American migration patterns.
Vermont gains second most residents, after Idaho
If we looked at purely the number of people moving in, the table would look quite different and favor the bigger states like Florida, Texas, and California, which attract higher volumes of people than, say, Idaho or Vermont.
However, adding the number of outgoing moves into the equation gives a more complete picture of which states gain the most new residents. Pandemic or not, the appeal of Idaho seems unwavering. In 2019, 49% more people moved into the Gem State than moved out of it. In 2020, that figure was at 103%, meaning twice as many people moved to Idaho than left it, higher than any other state.
The two states that came closest —Vermont and Maine — came in at 62% and 47% more people moving in than out, respectively.
On the opposite side of the scale, no surprises. Americans continue to leave states burdened by taxes, higher cost of living, and ever-expanding cities.
Consistent with our last year’s findings, California (-51%), New York (-50%), New Jersey (-40%), and Illinois (-37%) all lost more people than they gained from moving in 2020.
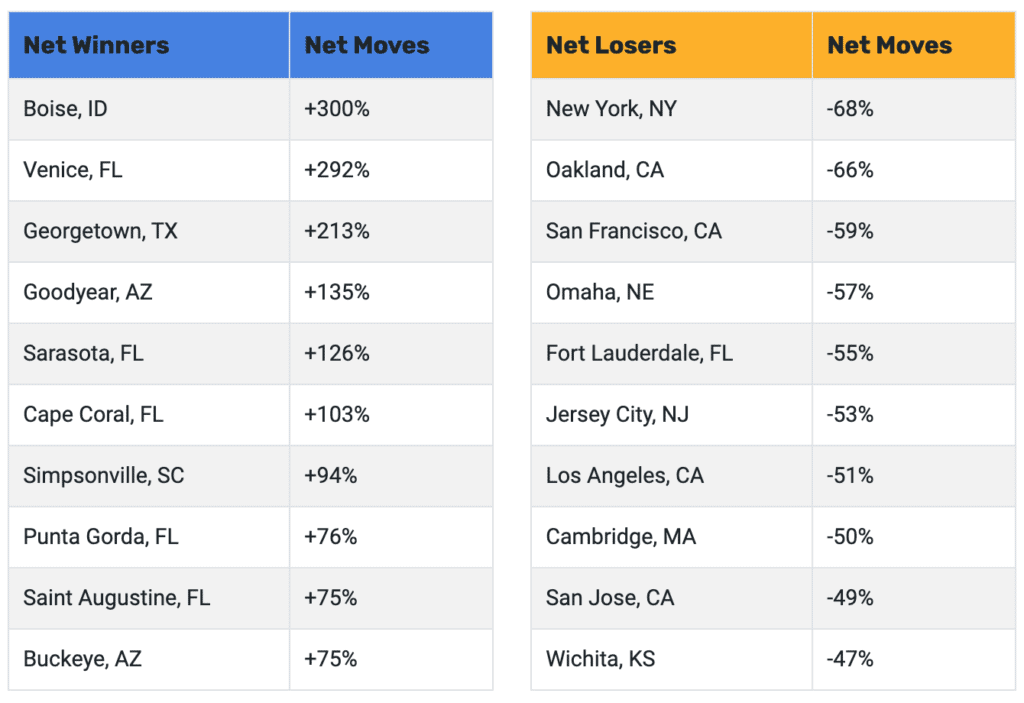
Cities also, in general across the country, lost population. Predictably, New York City came out as the biggest “loser” with 68% more people leaving the city than moving in. The usual suspects in California (San Francisco, Oakland, Los Angeles, San Jose) were all there, each having a net loss of around 50% in 2020. Less predictably, however, were Omaha, Nebraska (-57%) and Wichita, Kansas (-47%) being among the 10 cities that saw the greatest net losses from moving.
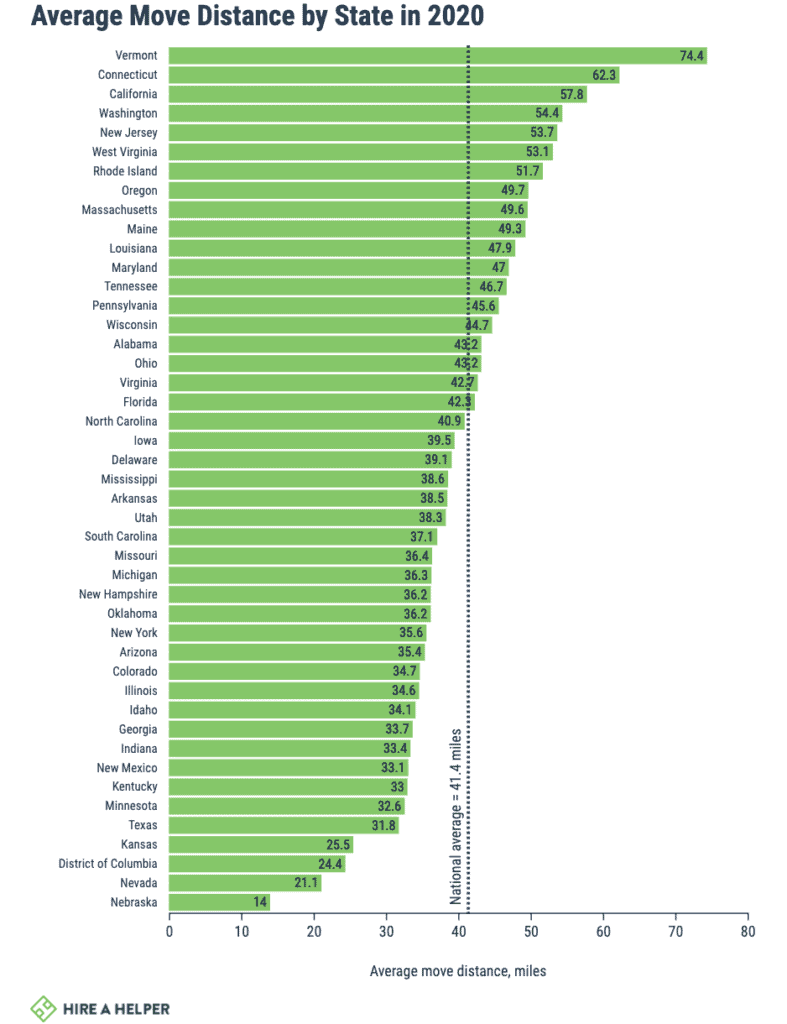
Moving farther away in 2020 was common across nearly all states, but the increase in moving distance was particularly drastic in Vermont (which topped this list at 74.4 miles), Connecticut, Washington, California, and Oregon. In all of these states, the average move in 2020 was at least 26 miles farther than in 2019.

While many respondents were keen on escaping the crushing costs of living in America’s biggest cities like New York City or San Francisco, they didn’t all move to the country. Some simply moved to smaller cities, which could still afford them a similar lifestyle at a lower price point.
Moves delayed
With the pandemic and associated restrictions setting in, Americans seemed to have put their moving plans on hold.
While 11.7% of all moves we tracked in 2019 took place in June, only 8.2% of moves we recorded in 2020 took place during this month.
As a result, the peak moving month was shifted to August. Even more interestingly, Americans continued moving throughout the fall at unprecedented levels, as if they were just delaying their moves originally scheduled for the spring when the pandemic first hit.
Over 20% of all moves that took place in 2020 happened either in September or October — months where during a regular year the moving starts to slow down. In 2019, for example, only 17% moved during these two months. Another factor contributing to this was likely remote schooling. Typically families do not choose to move right when kids are beginning the school year, but with remote schooling, these months no longer present a barrier.

Vermont tops the list with the highest number of miles its new residents moved in order to resettle there.


